DIY EEG signal acquisition and analysis on a microcontroller
By Breadboardhub Staff · Published 2026-08-12
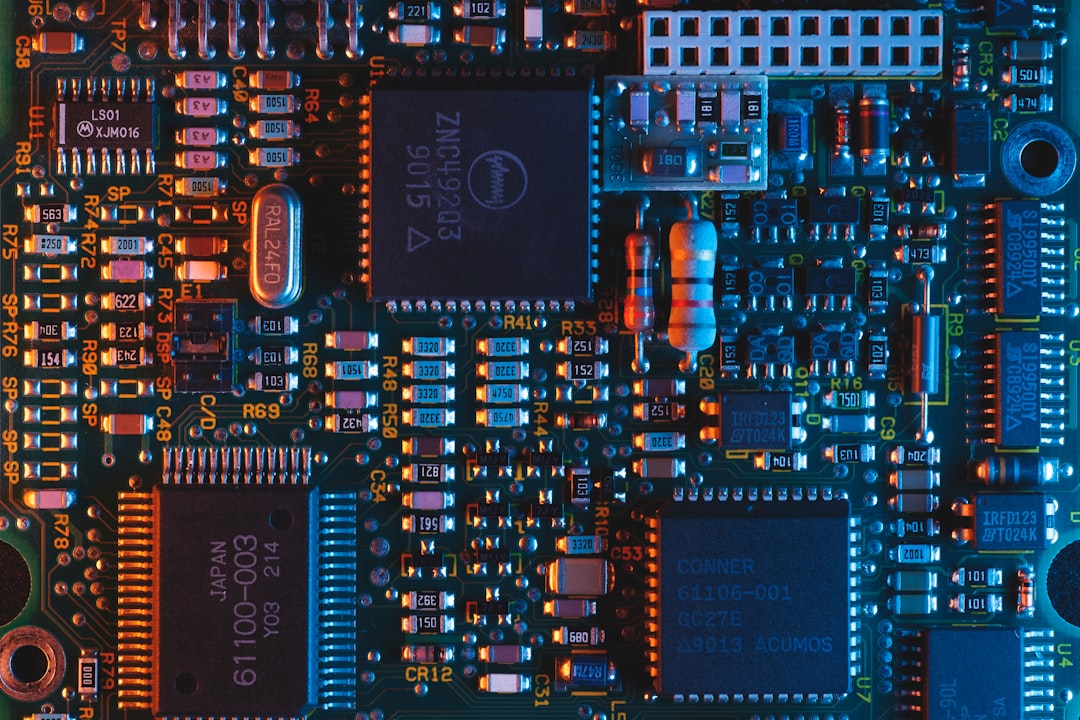
A $2 ADS1299 breakout board, a handful of Ag/AgCl electrodes, and an ESP32 or Raspberry Pi are enough to start pulling real brainwave data off your scalp and computing the same features used in published neuroscience research. Here is how to do it.
Hardware front-end
The brain signal at the scalp is roughly 10–100 µV, which is too small for a bare ADC pin. You need a dedicated bio-instrumentation amplifier front-end. Two common choices for makers:
- ADS1299 (Texas Instruments): 8-channel, 24-bit delta-sigma ADC with built-in instrumentation amplifiers, right-leg drive, and SPI output. Runs at 3.3 V. Connect DRDY to a GPIO interrupt pin, SCLK/MOSI/MISO/CS to the SPI bus. Throughput at 250 SPS per channel is comfortable for EEG.
- OpenBCI Cyton board: pre-soldered ADS1299 with a 3.5 mm electrode connector and onboard 3.3 V regulator. More expensive (~$200) but saves debugging time.
- Muse 2 headband: outputs pre-filtered EEG over Bluetooth LE (MUSE protocol). An ESP32 with a BLE library can subscribe to the raw EEG characteristic (UUID 273e0003-4c4d-454d-96be-f03bac821358) and receive 12-bit samples at 256 SPS.
Electrode placement matters a lot. For a basic meditation monitor, two active electrodes at Fp1 and Fp2 (forehead, just above each eyebrow) plus a reference at A1 (left earlobe) and a ground at A2 (right earlobe) gives you a workable frontal channel with minimal hair interference. Use Ten20 paste or a conductive gel. Skin impedance below 20 kΩ is your target; check with a 1 kHz tone from a function generator if you have one.
Wiring the ADS1299 to an ESP32
ADS1299     ESP32
---------   -----
SCLK   ->   GPIO18 (SPI CLK)
MOSI   ->   GPIO23
MISO   ->   GPIO19
CS     ->   GPIO5
DRDY   ->   GPIO4  (interrupt)
START  ->   GPIO2  (pull high to start conversion)
RESET  ->   3.3 V (or a GPIO for software reset)
VDD    ->   3.3 V
GND    ->   GND
The ADS1299 configuration registers you must set at startup: CONFIG1 to 0x96 (250 SPS, daisy-chain off), CONFIG2 to 0xC0 (test signal off), CONFIG3 to 0xE0 (enable internal reference, right-leg drive on). Channel registers CH1SET through CH8SET: set to 0x60 to enable the channel with a gain of 24 (appropriate for µV-level signals).
Software filtering pipeline
Raw samples off the chip still contain 50/60 Hz mains interference and electrode drift below 0.5 Hz. On a Raspberry Pi running Python, use scipy.signal:
from scipy.signal import butter, sosfiltfilt

def bandpass(data, lo=0.5, hi=45, fs=250):
    sos = butter(4, [lo, hi], btype='band', fs=fs, output='sos')
    return sosfiltfilt(sos, data)

def notch(data, f0=50, fs=250, Q=30):
    from scipy.signal import iirnotch, sosfilt
    b, a = iirnotch(f0, Q, fs)
    from scipy.signal import tf2sos
    return sosfilt(tf2sos(b, a), data)
On an ESP32 without floating-point-heavy libraries, implement a simple biquad IIR filter in integer arithmetic. Coefficients pre-computed offline with scipy.signal.butter and scaled to fixed-point Q15 format keep CPU time under 5 µs per sample.
Feature extraction: band power, coherence, wavelet entropy
A meditation monitoring study examining Samatha (focused attention) and Vipassana (open awareness) meditation found that delta-band power (0.5–4 Hz) showed the most consistent differences between rest and meditation states in experienced practitioners. This is the feature worth extracting first. (EEG-Based Characterization of Samatha and Vipassana Meditation States, Bandaranayake et al.)
Band power: compute a 256-point FFT on a 1-second Hann-windowed buffer. Sum squared magnitudes for each frequency band:
- Delta: 0.5–4 Hz (bins 1–4 at 256 SPS/256-point FFT)
- Theta: 4–8 Hz (bins 4–8)
- Alpha: 8–13 Hz (bins 8–13)
- Beta: 13–30 Hz (bins 13–30)
Normalize each band by total power to get a relative measure that is less sensitive to electrode contact variation.
Coherence between two channels measures how synchronized they are at each frequency. On a Raspberry Pi: scipy.signal.coherence(ch1, ch2, fs=250, nperseg=256). If you only have one channel, skip this.
Wavelet entropy: apply a discrete wavelet transform (pywt.wavedec(signal, 'db4', level=5)), compute the energy in each sub-band, normalize to get a probability distribution, then calculate Shannon entropy. Higher wavelet entropy indicates a more complex, less ordered signal. Relaxed eyes-closed states typically show lower entropy (more regular alpha oscillations) than active cognitive states.
What you can realistically measure on a breadboard
A breadboard setup with 20 cm jumper wires running near a USB cable will pick up significant 50/60 Hz interference. Short wires, twisted pairs from electrode to chip, and a shielded enclosure make a real difference. If you are measuring frontal alpha asymmetry (Fp1 vs Fp2 alpha power ratio, a common relaxation index), you need at least 30 seconds of artifact-free data per condition to get a stable estimate.
Do not expect to replicate fine frequency-domain differences between meditation styles on a first build. Instead, start with the alpha/theta ratio as a simple relaxation indicator, which changes enough to be visible even with mediocre electrode contact. The delta-band findings from the paper require very clean low-frequency response and good electrode stability, which is hard without proper abrasive paste and a controlled environment.
Limitations to know upfront
- Blink artifacts produce large spikes in the 0–4 Hz range. Without independent component analysis (ICA) or at least simple threshold rejection, your delta-band numbers will be contaminated.
- The study used 12 experienced meditators in a controlled lab. On a breadboard with yourself as subject and no meditation training, expect noisy baselines.
- A 24-bit ADC does not help if your physical noise floor (from the electrode-skin interface) is already 10 µV RMS. Focus on reducing skin impedance before worrying about ADC resolution.
- Real-time coherence and wavelet entropy at 250 SPS are feasible on a Raspberry Pi 4 but tight on an ESP32 unless you use smaller window sizes.
For a starting point on wiring biosignal circuits and exploring signal-processing sketches, the OpenBCI community forum and the CircuitPython ulab library (which gives you NumPy-like FFT on a microcontroller) are both worth bookmarking.
Attribution
Adapted from “EEG-Based Characterization of Samatha and Vipassana Meditation States” by M. A. B. C. A. Bandaranayake, K. P. U. Chandrathilake, J. L. S. Jayasekara, S. T. Piyasena, A. T. L. K. Samrasinghe, Wageesha N. Manamperi, licensed under CC BY 4.0 (https://creativecommons.org/licenses/by/4.0/). Source: https://arxiv.org/abs/2608.09784.
Original arXiv papers: